The 0.3 Percent of Rows That Ruined My Quarterly Report
A handful of duplicated shipments doubled a regional growth number, and I almost presented it to the board.


Three days before a quarterly review last year, I was looking at a chart that made me very happy. Sales of one of our product lines in northern Germany had grown 41 percent quarter over quarter. Everything else was flat or slightly up. I had a slide ready with a big green arrow.
Something about it bothered me, so I stayed late on a Thursday to check. By 10pm, the 41 percent had become 4 percent.
What I found
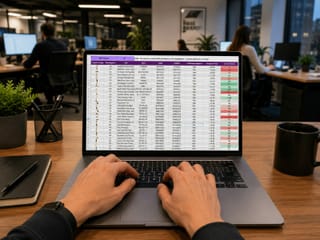
Our sales data comes from distributor reports, merged into a warehouse table that has about 2.1 million rows per quarter. When I filtered to that region and product line, I found a block of roughly 6,400 rows that looked suspicious. They had identical shipment IDs, quantities, and dates to other rows, but different upload timestamps.
One distributor had re-sent a month of data after a system migration on their side. Our pipeline treated the re-sent file as new data because the file name was different. Those 6,400 rows were about 0.3 percent of the quarter's data. In that one small region, they doubled the volume.

Why our checks missed it
We did have data quality checks. They tested for null values, for negative quantities, and for total row counts within a range of the previous quarter. A 0.3 percent increase in row count passed easily.
The problem is that aggregate checks are good at catching big, spread-out issues and bad at catching small, concentrated ones. A duplicate spread evenly across the whole dataset would barely move any number. A duplicate concentrated in one slice can dominate that slice.

What we added
After the review, which I presented with the correct 4 percent, we added three checks to the pipeline.
- A uniqueness check on the natural key. Shipment ID plus distributor plus line number must be unique. If not, the load fails loudly instead of silently appending.
- Per-segment change alerts. For each region and product line, if quarter-over-quarter change exceeds 25 percent in either direction, someone gets an email asking them to confirm it is real.
- A file fingerprint. We hash the content of every incoming file. If a new file has more than 50 percent row overlap with an existing one, it is held for review.
The per-segment alerts fire about four times per quarter. Three of those are usually real business changes. One is usually a data problem.
My new rule for big numbers
The chart that almost went into the board deck was correct, in the sense that it accurately summed the data in the table. The table was the problem.
My rule now is that any surprising number gets a second look at the raw rows behind it before it goes on a slide. Not a summary, not a pivot. The actual rows, sorted, with my own eyes. It usually takes 20 minutes. Once every few months, it saves me from a very awkward meeting.