The Spreadsheet That Beat Our Churn Model
We spent six weeks on a gradient-boosted churn predictor. A three-column spreadsheet from the support lead did better.

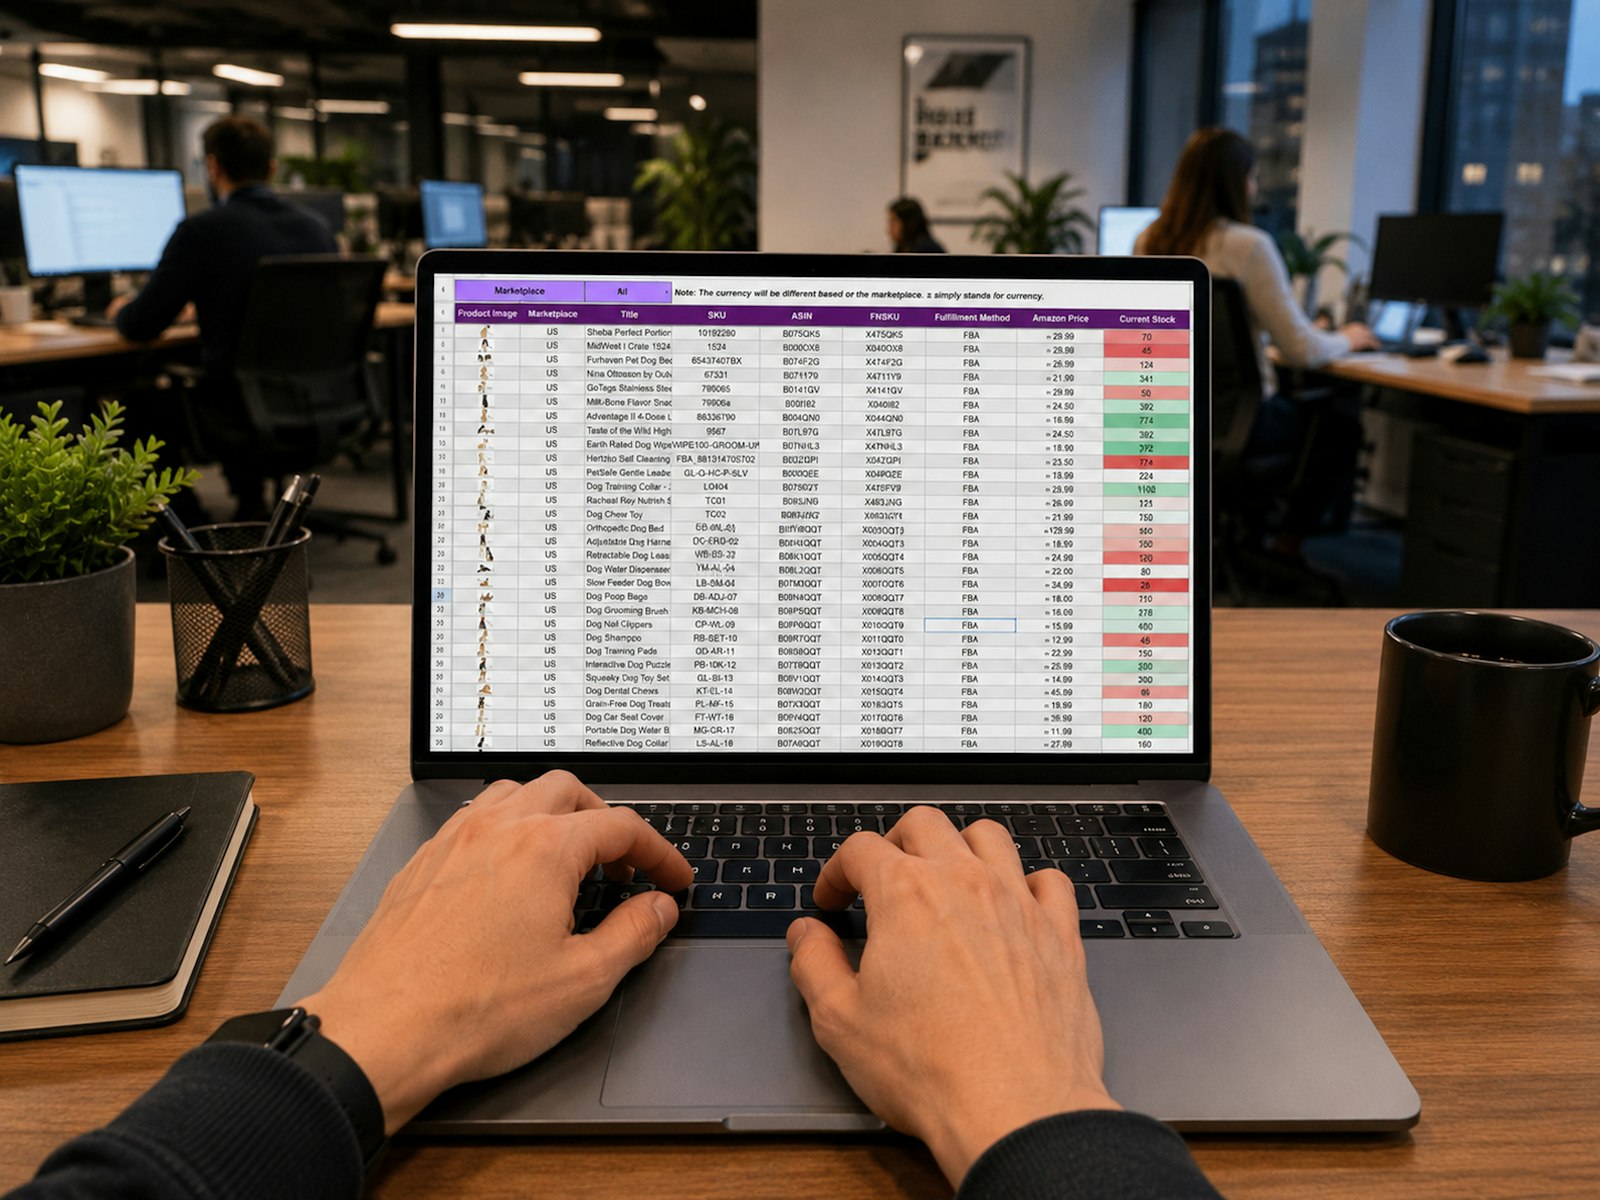
This is a slightly embarrassing story, and I tell it to every junior data scientist I work with.
A few years ago I was asked to predict which customers of a subscription software company were likely to cancel in the next 60 days. Classic churn problem. I had two years of usage logs, billing history, support tickets and product events. I was excited.
Six weeks of modelling
I engineered about 140 features. Logins per week, feature adoption, days since last export, seat utilisation, payment failures, you name it. I tried logistic regression, random forests and finally a gradient-boosted model. After careful cross-validation, the best one reached an AUC of 0.78. Respectable. I made charts. I was proud.
Then I presented it to the customer success team, and the support lead, a quiet woman who had been there for six years, said something like: that is interesting, I have a sheet that does this.

The spreadsheet
Her spreadsheet had three columns per account:
- Has the main admin logged in during the last 21 days?
- Has the account opened a ticket marked as frustrated in the last month?
- Did the person who signed the contract leave the company?
Any account with two or more yes answers went on her call list. She updated it by hand every Monday.
We back-tested her rule on the same historical period. It caught slightly more of the eventual churners than my model at the same call-list size, and every single flag came with a reason a human could act on.

What I got wrong
I had treated churn as a pattern-matching problem when it was really a domain problem. A few lessons stuck with me.
- The champion leaving was the strongest signal, and it was not in my data. She tracked it from LinkedIn and conversations. No amount of feature engineering on product logs would find it.
- Actionability beats accuracy. A score of 0.73 tells a success manager nothing about what to say on the call. Admin has not logged in for a month tells them exactly what to say.
- I never asked the people closest to the problem. I went straight to the data warehouse instead of spending a day sitting next to the support team.
What we built instead
We did not throw the model away. We added her three signals as features, collected the champion-change field properly in the CRM, and the combined model improved meaningfully. More importantly, the dashboard now showed the top reasons for each flag, in plain words, next to the score.
The best feature you will ever engineer is usually sitting in someone else's head.
Now, before I open a notebook on any new problem, I book an hour with whoever does the job manually today. It is the cheapest hour in any project, and it has saved me from building another beautiful model that a spreadsheet could beat.
Cover: Photo by Gorilla ROI Data Connector on Unsplash.