Your Lighthouse Score Is Not Your Users' Experience
Lab tests run on a perfect machine in a perfect network. Your customers live somewhere else entirely.

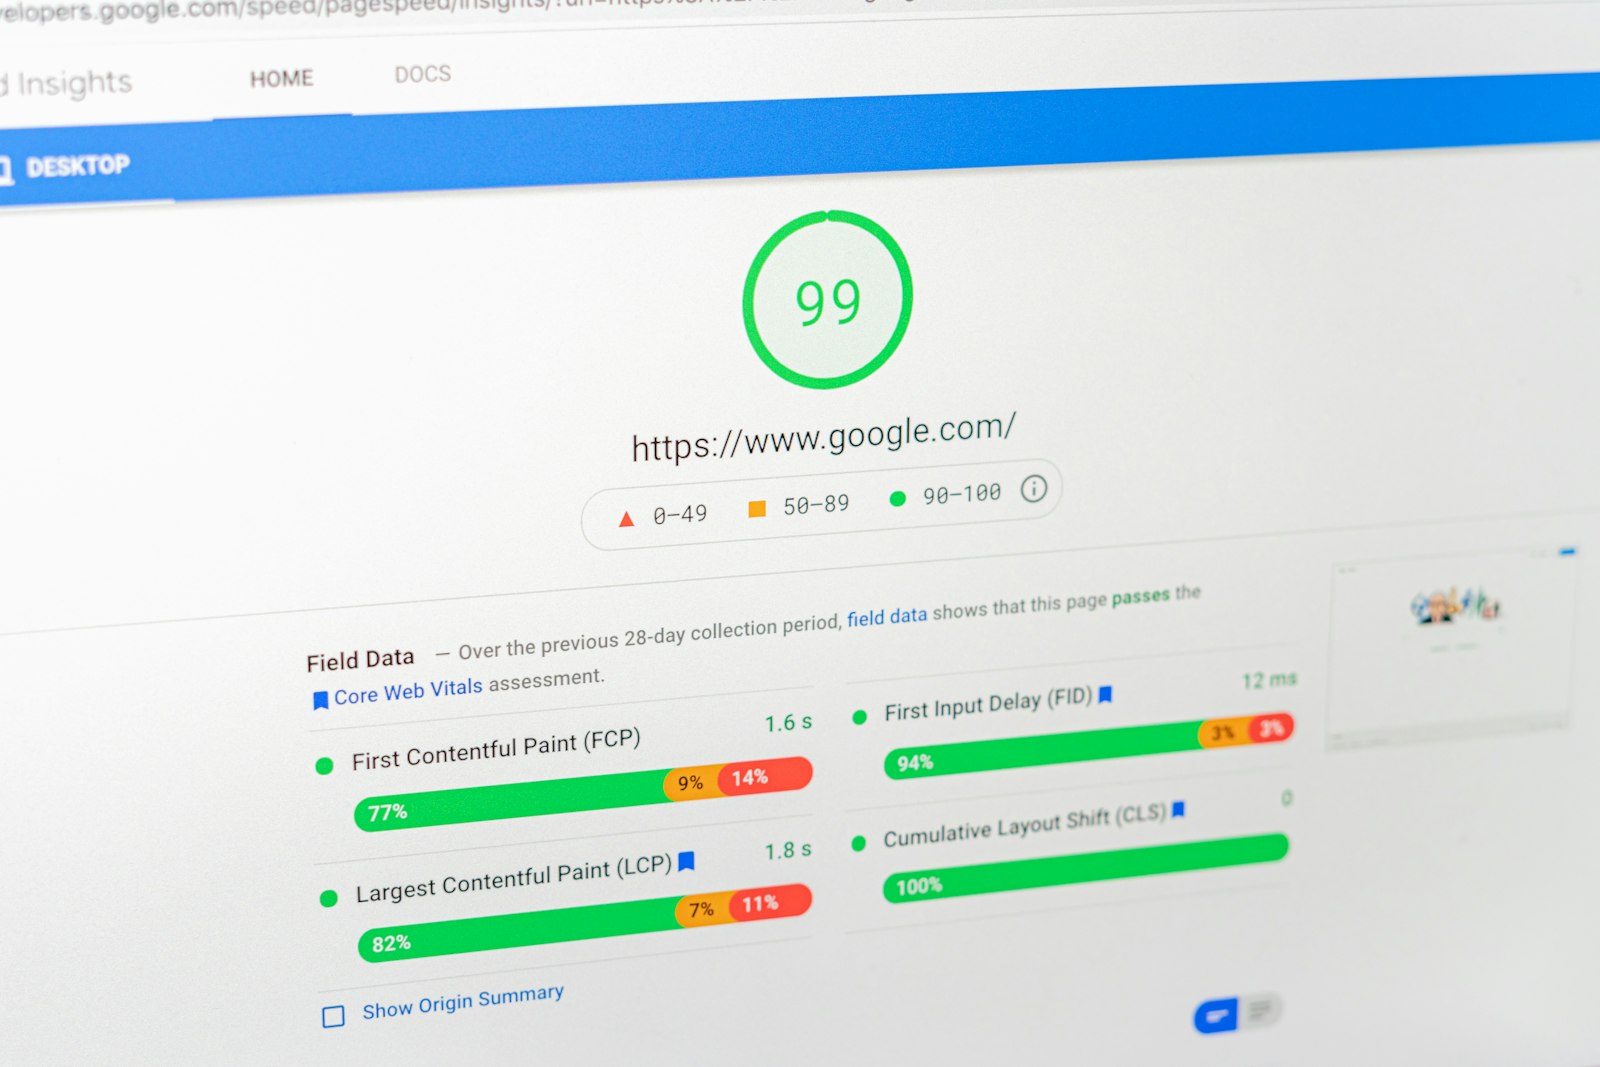
We had a Lighthouse performance score of 98. I had it screenshotted in a team channel. Two weeks later our support inbox filled with complaints that the checkout page felt 'frozen' after tapping the pay button.
Both things were true at the same time. That is the lesson I want to unpack.
Lab data versus field data
Lighthouse is a lab tool. It loads your page once, on a simulated device, with a throttled but predictable network, and it never touches anything. It measures how the page loads, not how it behaves when a tired person on a three-year-old phone starts tapping.
Field data is what real browsers report from real sessions. It is noisy, uneven and occasionally humiliating. It is also the only number your users experience.
Our lab score was measuring a page nobody used. Our users were measuring a page that ran a 600-millisecond validation function on every tap.
The metric that caught us
Interaction to Next Paint measures the delay between a user's input and the next frame the browser paints. It is a field metric by nature, because a lab run does not interact. When we finally looked at our real-user numbers, the 75th percentile on checkout was well over half a second.
The culprit was ordinary: a form library re-validating every field, synchronously, whenever any field changed. On my laptop it took 30 milliseconds. On a budget phone it took twenty times longer.
What we changed
- Validation now runs only on the field that changed, plus the submit handler.
- The expensive address lookup yields to the browser before it starts, so the button press paints immediately.
- We show a pressed state on the button in the same frame as the tap, before any work begins.
That last change was a single line of CSS and it did more for perceived speed than everything else combined. People forgive work that they can see is happening. They do not forgive silence.
How I read scores now
I still run Lighthouse. It is a fantastic smoke test for regressions in loading. But I treat it like a blood pressure reading taken in a calm room: useful, and not the same as how you feel climbing stairs.
A green score means the page can be fast. Field data tells you whether it is.
If you take one thing away, make it this: pick your three most important pages and find out what your real users' 75th percentile looks like on them. The number will probably surprise you. Mine did, and our checkout is better for it.
Cover: Photo by Justin Morgan on Unsplash.