What a Restaurant Menu Taught Me About Information Hierarchy
Waiting forty minutes for a table, I studied a menu instead of my phone. It turned into the best design lesson I had all year.

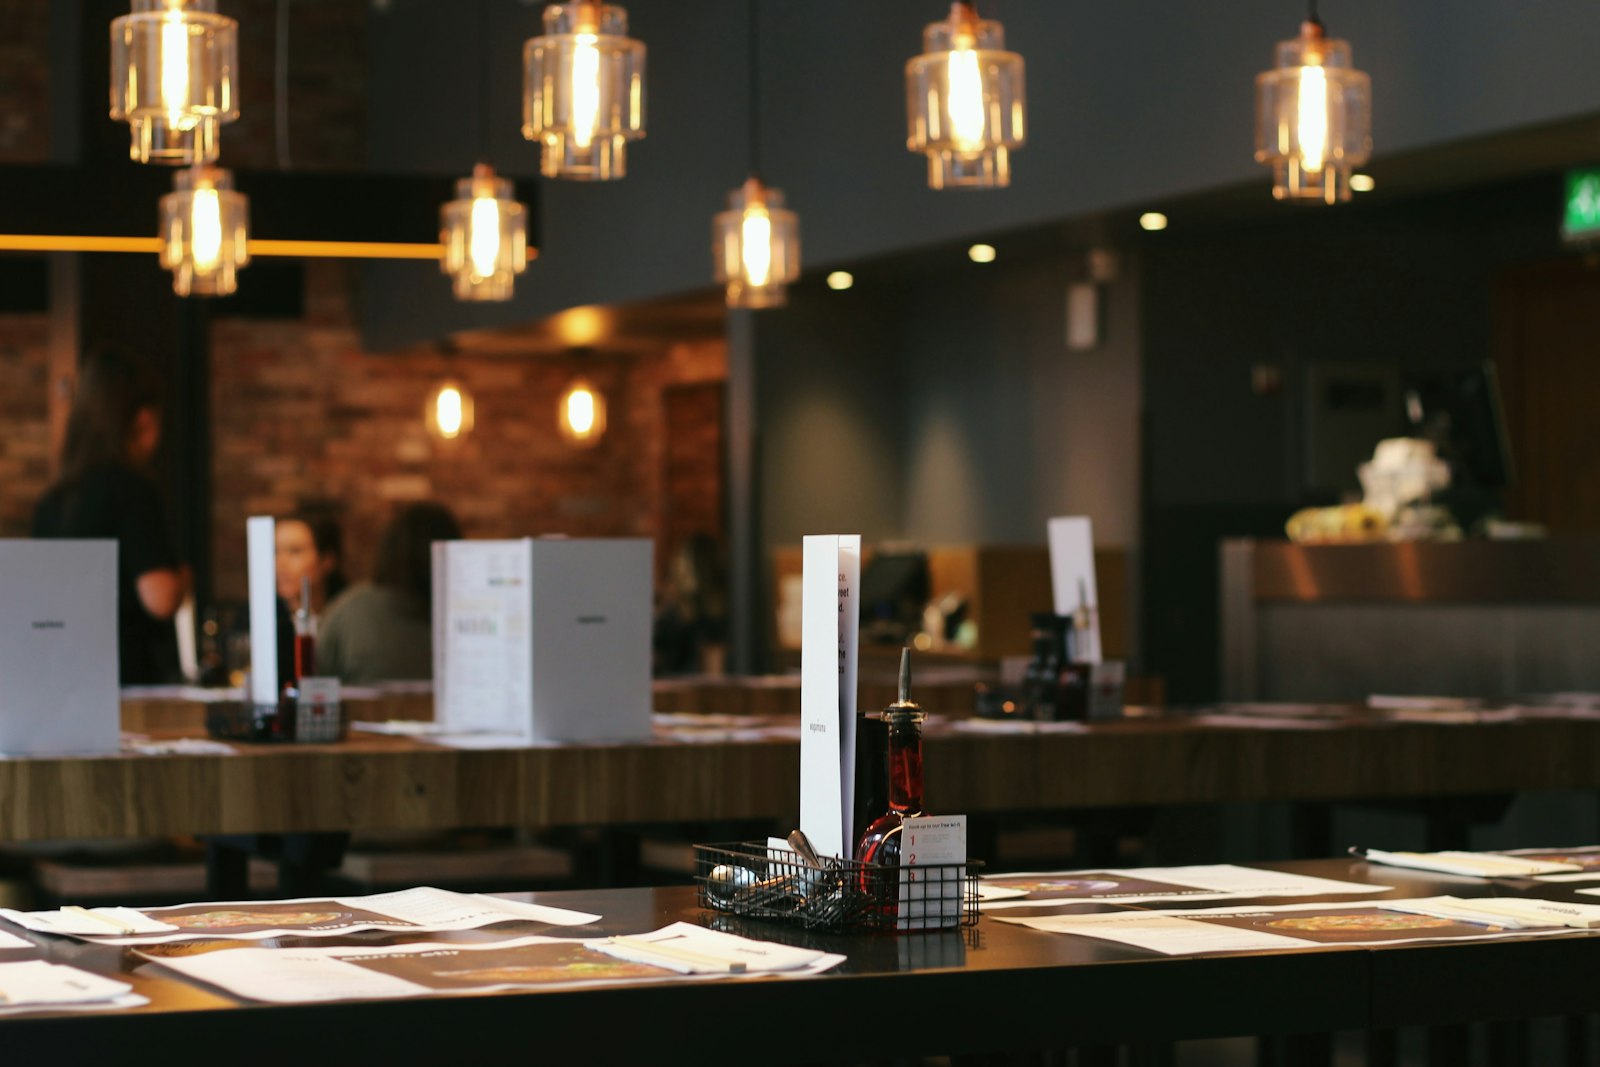
A few months ago I waited forty minutes for a table at a busy little bistro near my flat in Södermalm. My phone was at 4 percent battery, so I did something unusual. I read the menu. Carefully. Twice.
It was one of the best examples of information hierarchy I have seen, and it was printed on a single laminated card.
The problem a menu solves
A menu has a hard job. A hungry, distracted person needs to choose from dozens of options, often in under a minute, while talking to friends. It cannot have a search bar or filters. Everything is visible at once.
That is surprisingly similar to a dashboard, a pricing page or a settings screen. Lots of options, limited attention, a decision at the end.
What the menu did well
Clear groups with obvious labels
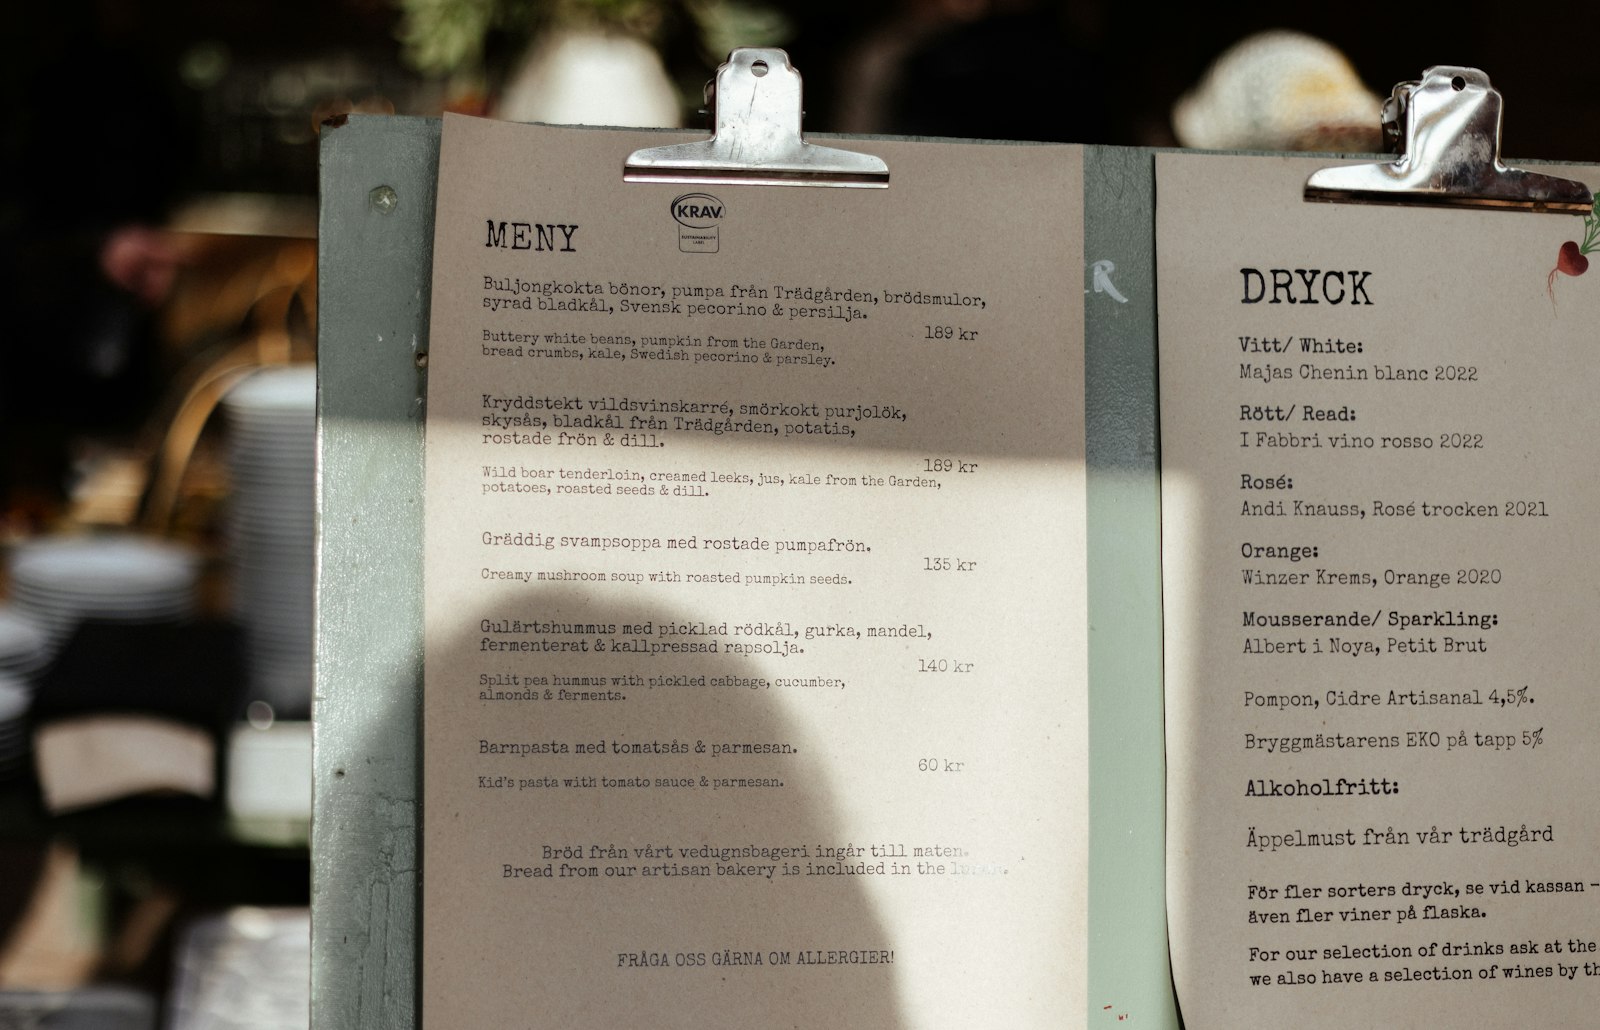
The card was split into five sections: Small plates, Soups, Mains, Sides and Drinks. No clever names. Each heading was in bold capitals with plenty of space above it. I could scan the whole structure in about two seconds.
A consistent pattern inside each group
Every item followed the same structure: name in bold, a short description in regular weight, price aligned to the right. Because the pattern never changed, my eyes learned it after three items and could skim the rest quickly.
A small number of highlights
Three dishes had a tiny star and the words house favourite. Only three, out of about forty. That restraint made them stand out. When I asked the waiter later, he said those three were the most ordered dishes by far.
Prices that did not shout
Prices were in the same size as descriptions, without currency symbols. It was a subtle choice that kept attention on the food rather than the cost.
Lessons for screens
I came home and wrote down what I wanted to steal:
- Name groups plainly. If a section label needs explaining, it is the wrong label.
- Repeat a pattern relentlessly. Consistency is what makes scanning possible.
- Highlight sparingly. If more than about 10 percent of items are emphasised, emphasis stops working.
- Separate with space, not lines. The menu had almost no dividers. Generous gaps did the job.
- Keep secondary data quiet. Not every number needs to be big and bold.
Trying it at work
The following week I used these ideas on a cluttered analytics page we had been struggling with. We grouped twelve metrics into four plain sections, gave every card the same structure, and highlighted only the two numbers leadership actually asked about every Monday.
Nothing else changed. In feedback sessions, people found the metric they needed in about half the time.
Good hierarchy answers a question before the reader has finished asking it.
The meatballs, by the way, were excellent. I chose it in about eight seconds.
Cover: Photo by Samuel Foster on Unsplash.